Model Overview
Model name: GO Device Installation Monitoring model
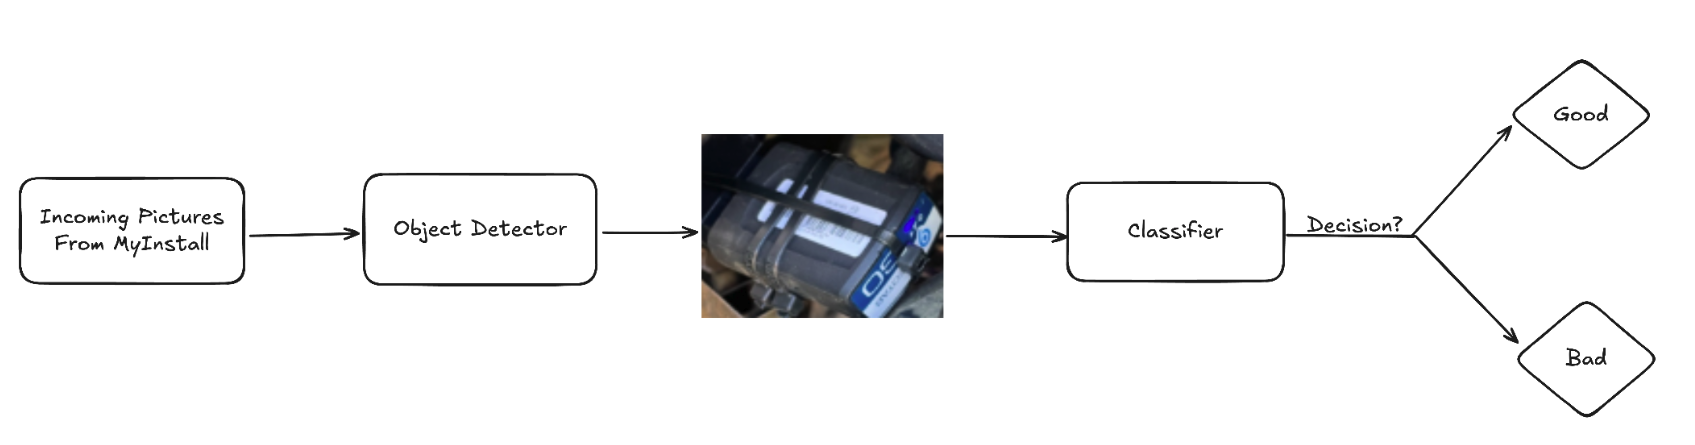
Goal: Installing GO devices is a universal step for all Geotab customers. As part of the installation process, customers must submit a picture of the installed device. The models detect and verify that the GO device has been correctly installed to reduce potential problems from improper installation.
Base model: Pre-trained Yolo11 computer vision models, where nano and x-large determine the size and complexity of the model.
- Yolo11 nano detection
- Yolo11 extra-large classifier
Model type: Object detection and image classification
Model version: 2
Developed by: Data observability
Intended Use
Primary intended uses:
- The object detection model shall be used to locate GO devices and their installation from customer-uploaded images to the MyInstall service within MyAdmin.
- The classifier model analyzes located objects (GO devices) in the image to determine if the installation is good or bad.
- More accurate identification of potential GO device installation issues will improve customer satisfaction and reduce malfunctions/errors.
Out-of-scope uses: This model is specifically designed for capturing installations of GO devices. It does not cover the installation of external hardware, OEM devices, third-party solutions, or the following accessory integrations:
- Input Output Expanders (IOX)
- Hardware accessories
- Harness and adapters
Targeted users/User groups: The model enhances the MyAdmin and MyInstall team's operations by decreasing the reliance on manual reviews. This will lead to quicker customer feedback and significantly improve efficiency and scalability managed by all support operations.
Factors impacting model performance: Model performance is significantly impacted by noisy data. Customer submissions frequently include several images of GO devices. However, only images of installed devices are relevant, because uninstalled devices are typically classified as improper installations.
Data
This section outlines the key aspects of the images used to develop and evaluate the model. We first describe the training and validation images, and then detail the data pipeline and preprocessing steps used to prepare the image for modeling. Lastly, we discuss the privacy considerations and protections implemented to ensure responsible handling of sensitive data.
Description on training and test images
- Training images were gathered by the installation team and must be in JPEG, PNG, or JPG format.
- Object detection model training utilized 2300 images, of which 10% were background images without GO devices. These background images were included to improve the model's ability to distinguish between images that contain a GO device and those that do not.
- Each image requires a corresponding label file defining object bounding boxes. Some labels may be empty, indicating a background picture (which still requires an empty label without bounding box dimensions).
- The image classification (IM) model utilizes 4200 images (2100 good, 2100 bad installations), and during retraining, correctly classified images are used by the object detection (OD) model in the pipeline.
- For both models, the images are split into training and validation sets to assess performance.
Data pipeline and preprocessing
The machine learning pipeline designed to detect bad installations of GO devices uses two main components using the Airflow orchestration (directed sequence of tasks with no loops or cycles):
- An object detection model that identifies the GO device and provides the boundary box of the GO device in the image.
- A classification model for distinguishing between good and bad installed devices.
- Initially, a small labeled dataset from the video analytics team (for object detection) and manually labeled data for image classification were used to start the process.
- A self-supervised learning approach was followed to expedite the labeling process and save time, a small, readily available labeled dataset was utilized for labeling the data.
- The object detection task involved labeling data with bounding boxes around GO devices or marking background images as empty files. In contrast, the image classification task categorized images as either good or bad installations.
- A hard-negative mining technique was implemented to improve the model by incorporating its mistakes from one training iteration into the dataset for the next.
- Object misdetections are added as unlabeled background images (up to 10% of training data) to the training set.
- When the classifier misclassifies an installation by labeling a bad install as good, this error is incorporated into the correct class (bad install) during the model retraining process.
Data privacy
- Inputs to both the models are images captured during GO device installation.
- Images from MyInstall often contain stickers and GO device serial numbers. This Personally Identifiable Information (PII) is used for internal Geotab purposes in training and evaluation, and is not exposed to Large Language Models (LLM).
- A Privacy Threshold Assessment (PTA) was performed and approved before the model was deployed.
Ethical Considerations, Assumptions, Constraints
In this section, we highlight some ethical challenges that were encountered during model development, including bias and fairness considerations, and present our solutions to overcome these challenges. Additionally, we provide the assumptions and constraints of our model, including any limitations in the data or the model's scope that could affect its performance, to foster understanding of the model's strengths and limitations to stakeholders which is crucial to responsibly use the model and interpret its results.
Risks in training
- The object detection model may misdetect objects, and eventually cause images to be incorrectly classified as bad installations. However, this is expected to improve with feedback loops.
- GO devices that are not installed are a common source of noise and are currently classified as poor installation due to the absence of cable ties.
Data bias handling
- The misdetections and noise are often categorized as "bad" installations. To address the issue, images were labeled and prioritized to use only "good" installation photos.
- Processed good installation logs are now filtered to eliminate irrelevant images identified as noise or misdetections, retaining only the most representative image. This filtering has significantly reduced the number of irrelevant images to the model.
Model assumptions and constraints
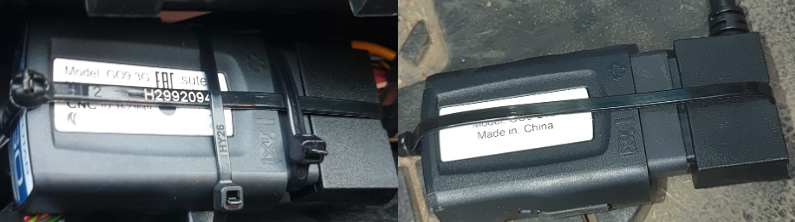
- This object detection model identifies images with GO devices, regardless of whether they are installed or placed on a surface. The key indicator of a correct GO device installation is the presence and configuration of criss-crossing cable ties.
- The classifier model defines proper GO device installation as securing it with horizontal cable ties completely around the device.
- Poor GO device installation is indicated by obstructions, interfering cables, and specific cable tie issues like horizontal ties on metal without fully encircling the device, or missing and obstructed device visibility showing only the logo.
Evaluation Metrics
The object detection model was evaluated on the unseen images and the following metrics were used to assess the model performance:
- The best-performing model achieved a precision of 97.7%. This indicates that the model accurately identifies GO devices in images 97.7% of the time.
- The model has a 93.7% recall, indicating a low 6.3% chance of failing to detect a GO device in a relevant image.
- The model is excellent at generally locating GO devices in images, achieving a 98% mAP50 (Mean average precision calculated at an intersection over union (IoU) threshold of 0.50).
- Even when it needs to be very precise about exactly where the GO device is located, the model still performs strongly with an 79.1% mAP50-95 (The average of the mean average precision calculated at varying IoU thresholds, ranging from 0.50 to 0.95).
Intersection over Union (IoU): IoU is a measure that quantifies the overlap between a predicted bounding box and a ground truth bounding box. It plays a fundamental role in evaluating the accuracy of object localization.
The image classification was evaluated on the unseen images and the performance metrics used to assess the model are accuracy, precision, recall and F1 score:
- Accuracy measures the overall percentage of correct classifications. The best model has an accuracy of 93.6%, meaning that it correctly predicts whether a GO device installation is good or bad 93.6% of the time.
- Precision measures how often positive predictions are accurate. The precision of the best model is 93.6%. This means that when the model predicts an event as a good installation, it is correct 93.6% of the time.
- Recall quantifies how well the model classifies the actual positive cases. The recall of the best model is 93.6% meaning there is only a 6.4% chance that an event will be missed as a bad installation.
- F1 score of 93.6% suggests that the image classification model shows a good balance between precision and recall when classifying images of GO device installations as good or bad.